Yield Curve Inversion
And what it means for you

For a time, everything we heard about financial markets was the doom and gloom story.
Recession imminent!
No one is safe!
One of the most significant indicators of this unstoppable storm was the inversion of the yield curve.
Some of you may know what that is, but it’s helpful to take a step back and understand what the talking heads mean when discussing the yield curve inverting and its implications for investors.
What is a “Yield Curve?”
To put it as simply as possible, it is the difference between two bond yields of differing maturities.
Another step back: Bonds are funding instruments issued by corporations and governments that can be boiled down to an agreement between two parties to repay a debt later at a pre-determined interest rate.
For example, The Government issues Treasury bonds, backed by the full faith and credit of the US Government, in all its taxing might and power, to investors. We, investors, buy these Treasury bonds with the understanding that by paying $1,000 today (or sometimes $950), we are relatively assured that the government will pay us back that $1,000 in 10 years plus a 2% simple interest rate.
A yield curve looks at two different bonds; one matures in 10 years, and the other matures in 3 months, and it asks, what is the difference between these two yields if we subtract the longer-dated bond yield from the shorter-dated yield?
Most of the time, as you might expect, the bonds that mature in 10 years offer a higher interest rate. Investors agree to forego access to that $1,000 for ten years; they ought to be compensated for that (we call this both a term premium, being paid more for investing over a longer period and therefore being subject to interest rate changes over that time, and a liquidity premium, being compensated more for not having access to your money for longer).
And investors that forego their money for only three months will generally be willing to accept a much lower interest rate.
After all, what could go wrong in 3 months?
Looking at the yield curve for Treasury bonds and seeing that the 3-month Treasury Bill has a higher interest rate than the 10-year Treasury might raise some questions.
What does it mean when the Yield Curve Inverts?
You might be asking, “Why are shorter-term investors compensated more for a 3-month bond than a 10-year bond?”
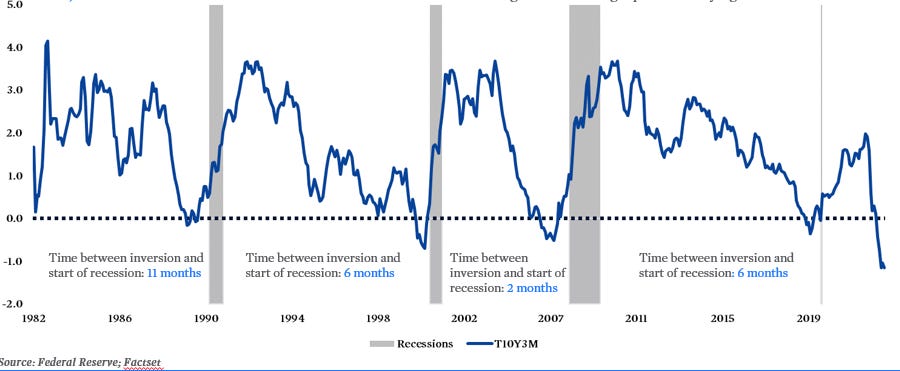
If we look back just five years at the movement of interest rates between these two bonds, we are looking at the 3mo10y Yield Curve. Notice anything in the chart below from the Federal Reserve?
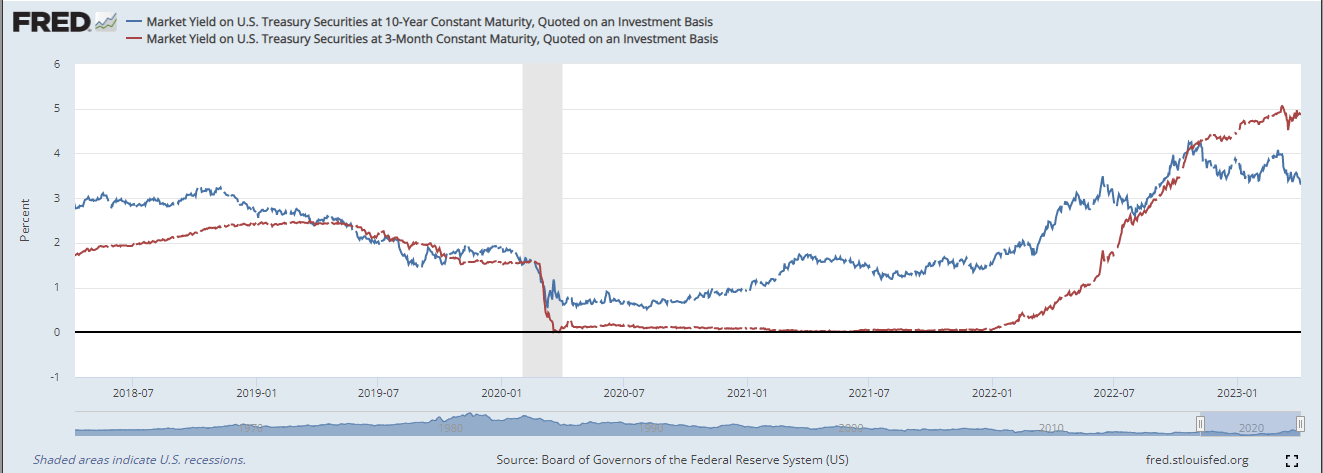
Most of the time, that 3-month yield is below the 10-year yield. But at specific points (only one in the chart directly above, but four in the chart below), the 3-month yield rises above the 10-year, and something follows closely on the heels of that inversion.
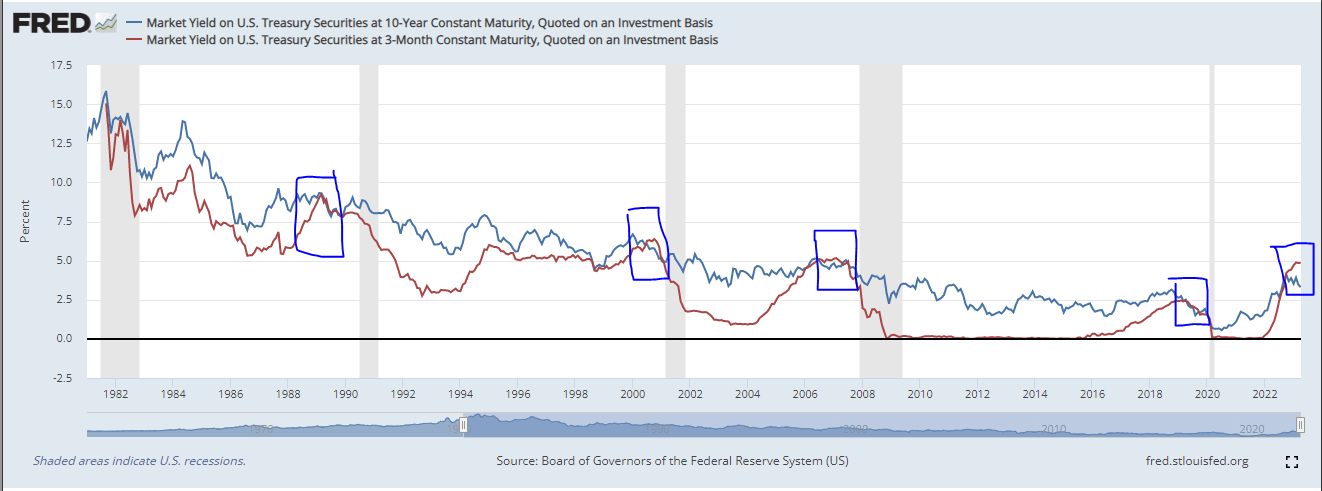
(Forgive my box drawings above, they are merely an attempt to highlight the points of inversion.)
Historically, a recession follows every time the 3-month Treasury Yield is above the 10-year Treasury Yield (for at least three months consecutively).
Before we dive into what that means, I got ahead of myself again, and we should pause briefly. What is driving the change in these rates? Why does it happen that the 3-month yield happens to be above the 10-year?
10-year Treasury yields are a factor of investor sentiment, Federal Reserve decisions, and macroeconomic factors. As confidence in the state of the economy ten years in the future wanes, investors are more likely to buy up Treasury Bonds than public market stocks.
Who’s to know if XYZ Corporation can repay that bond in 10 years? Investors generally can lean on the idea that the US Government will still be here in 10 years and can effectively pay back those bonds without issue.
One thing we should have mentioned about bonds above is that the investor demand for those bonds influences interest rates on bonds bought and sold in the open market. If more investors buy the bond, the price will increase (maybe from 95.95 to 99.97), but the interest rate will fall.
Yield and Price on bonds are inversely related. One goes up; the other goes down.
So, suppose more investors are buying the 10-year Treasury Bond because they are unsure of what the world will look like in 10 years. In that case, they are relying on the Government having a better likelihood of being here than XYZ Widget Corp, which will lower investors’ yield from that Treasury Bond because demand has driven the price up.
While investor demand and sentiment drive the price and yield for longer-dated bonds, the short-term bonds (our 3-month Treasury) have a much more straightforward explanation:
Federal Reserve Open Market Committee Rate Hikes.
In 2022, the Federal Reserve raised short-term interest rates from near-zero to over 4%. This was the fastest rate hike in recent history.
Visual Capital made this awesome chart in October of 2022, but the Federal Reserve didn’t stop at the ~2.5% rate you see here:
")
As the Fed raises the Fed Funds rate, which only directly applies to Banks and overnight lending, this effectively increases the floor on short-term rates across many investment vehicles.
Hopefully, you can see then that as the Fed moved lightning fast to raise short-term rates, the 3-month Treasury interest rates also increased quickly. Much quicker, overall, than the rates on 10-year bonds.
This led to the 3-month rate eclipsing the 10-year rate. And created what we have been referring to as the Yield Curve Inversion.
One thing to note when referring to the yield curve, major talking heads, news cycle analysts, and the like generally refer to the Yield Curve inversion as the difference between the 2-year Treasury and the 10-year Treasury rather than the 3-month.
Interestingly, the inversion of the 2s10s has not been a reliable predictor of recessions. Only the 3mos10y inversion can be relied upon.
What does the Yield Curve Inversion mean for Us (Investors)?
But, even if we rely on this to indicate what is to come, it is only one variable in the web of information we must analyze and review to make investment decisions going forward.
Just because we know (or can be reliably confident) that a recession will happen, the inverted yield curve tells us nothing about how the market will react.
Will it drop by 40%? 30%? Did we already see the drop last year?
We looked at the fact that Markets often precede the economy in my post earlier this year:
It is possible that the market correction we saw last year was another indicator of slower GDP growth in 2023, and the market may not go down any further.
<I haven’t earned my crystal ball yet, so I’m unsure if this is true.>
The reaction from the market is a huge unknown, and if we look back at the last four recessions that inverted yield curves have predicted, we get a wide range of potential outcomes:
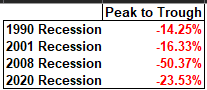
On top of that, and noted in the first chart at the top, who’s to say how long the inevitable recession will last? It could be 11 months or two months. It could be 36 months or six months.
The point to be made here is that an inverted yield curve is an excellent source of information. But it only answers some of the questions and should not be the driver for significant investment changes.
-JM